Sentinel Map
Creating a Sentinel workbook to map attacking IPs to geographical coordinates
GeoIP Integration
We will use a CSV file to map IP addresses to geographical coordinates. You can use any GeoIP datasource such as MaxMind or any API, however it is worth noting that there is no definitive way to accurately map an IP address to a location. IP addresses are allocated to organizations rather than individuals, and registration data is publicly available through regional internet registries. The location data are rough estimates.
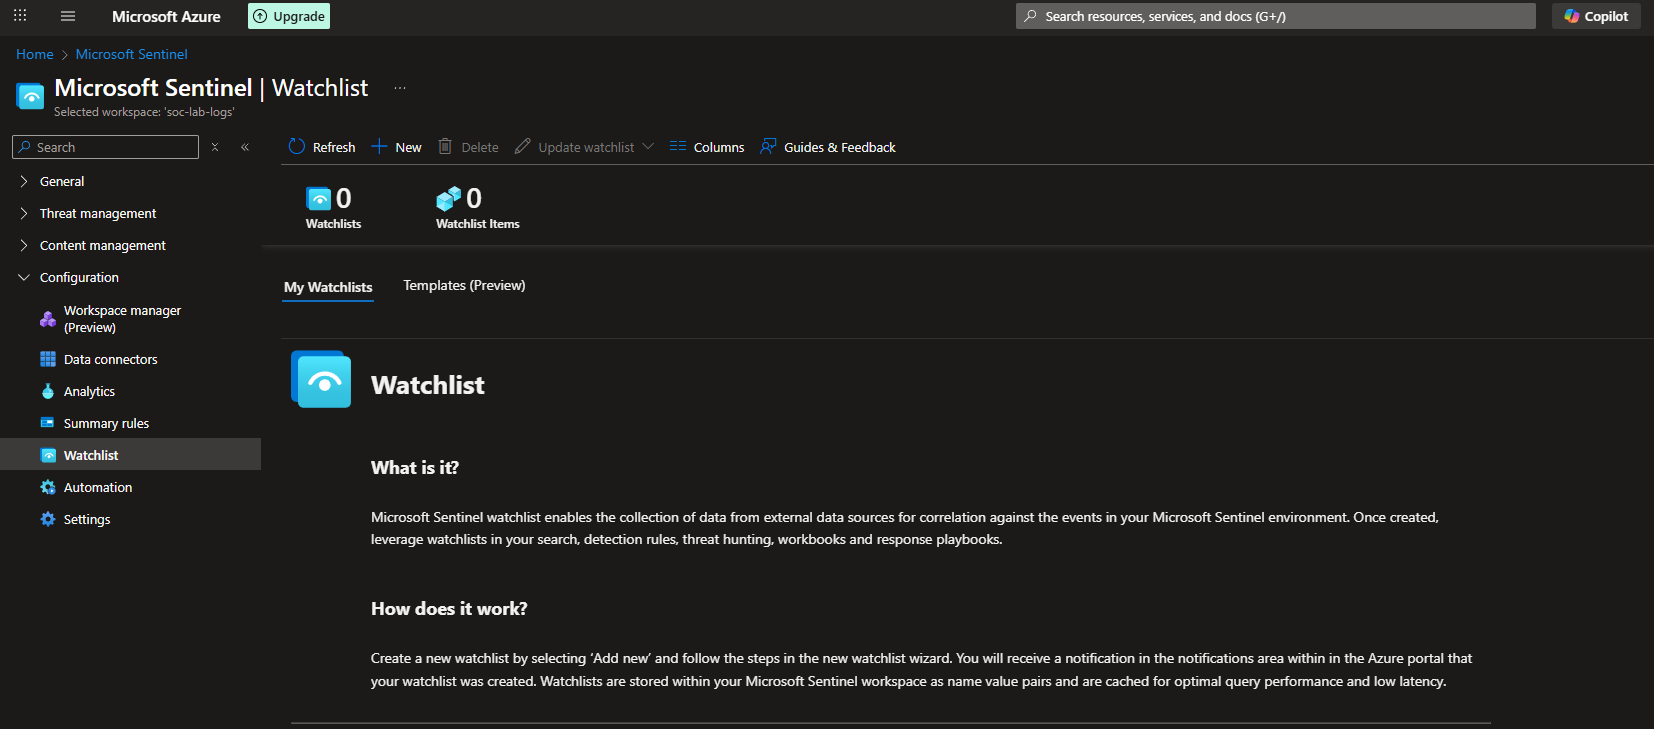
In the Sentinel dashboard, head to Configuration > Watchlist
Click New
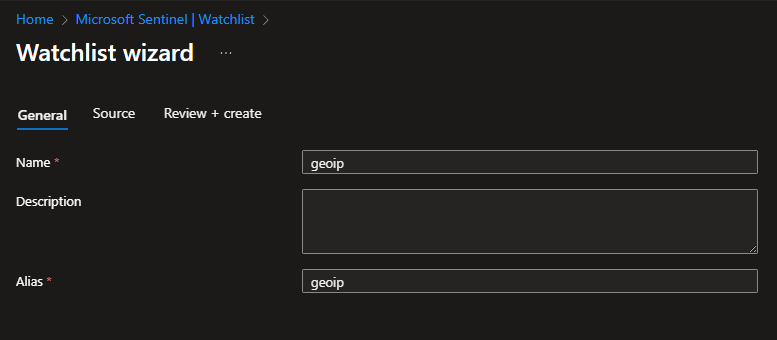
Give the watchlist a name and alias, i just set them to geoip
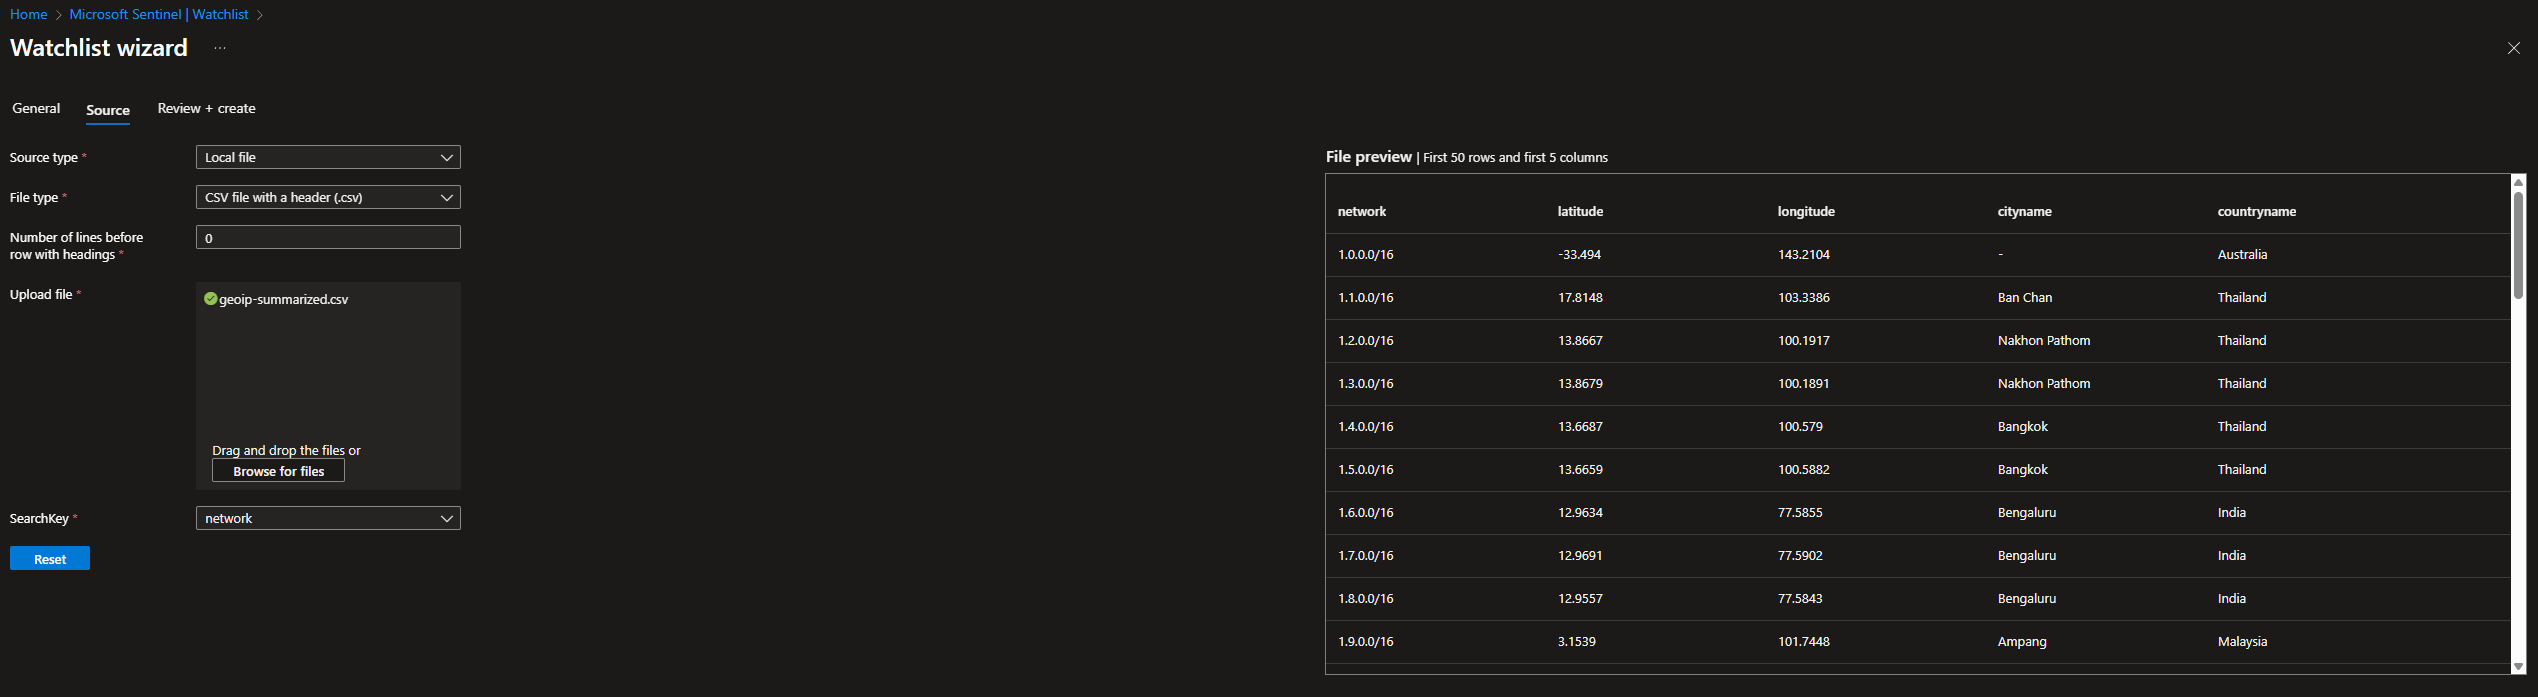
We will use an external CSV file that maps IP addresses to cities and countries, as well as their coordinates.
For Source type, select local file (unless you want to take the extra step and set up a blob)
For File type, select CSV
Leave Number of lines before row with heading to 0
set SearchKey to network
Download the file locally and then upload it here
We should see a file preview, showing coordinates for the cities and countries
When everything looks good, click review + create
Give this a few minutes to completely upload
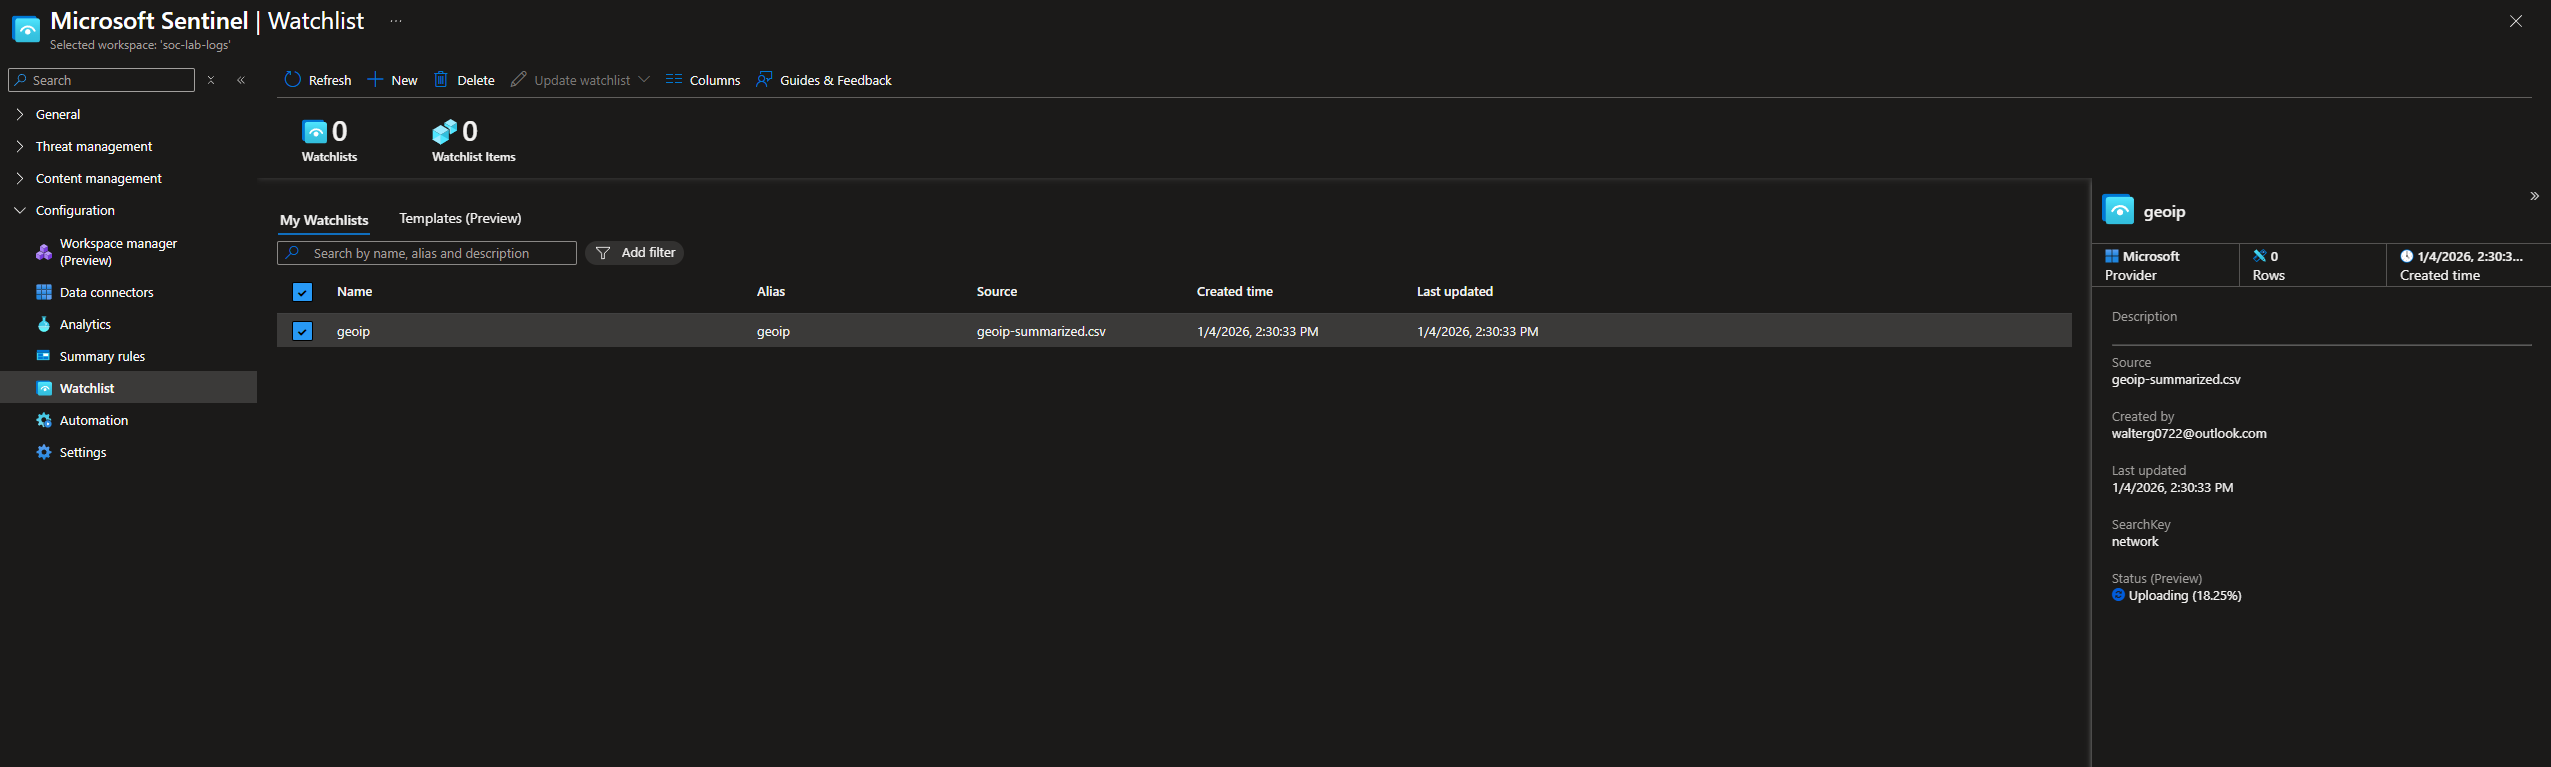
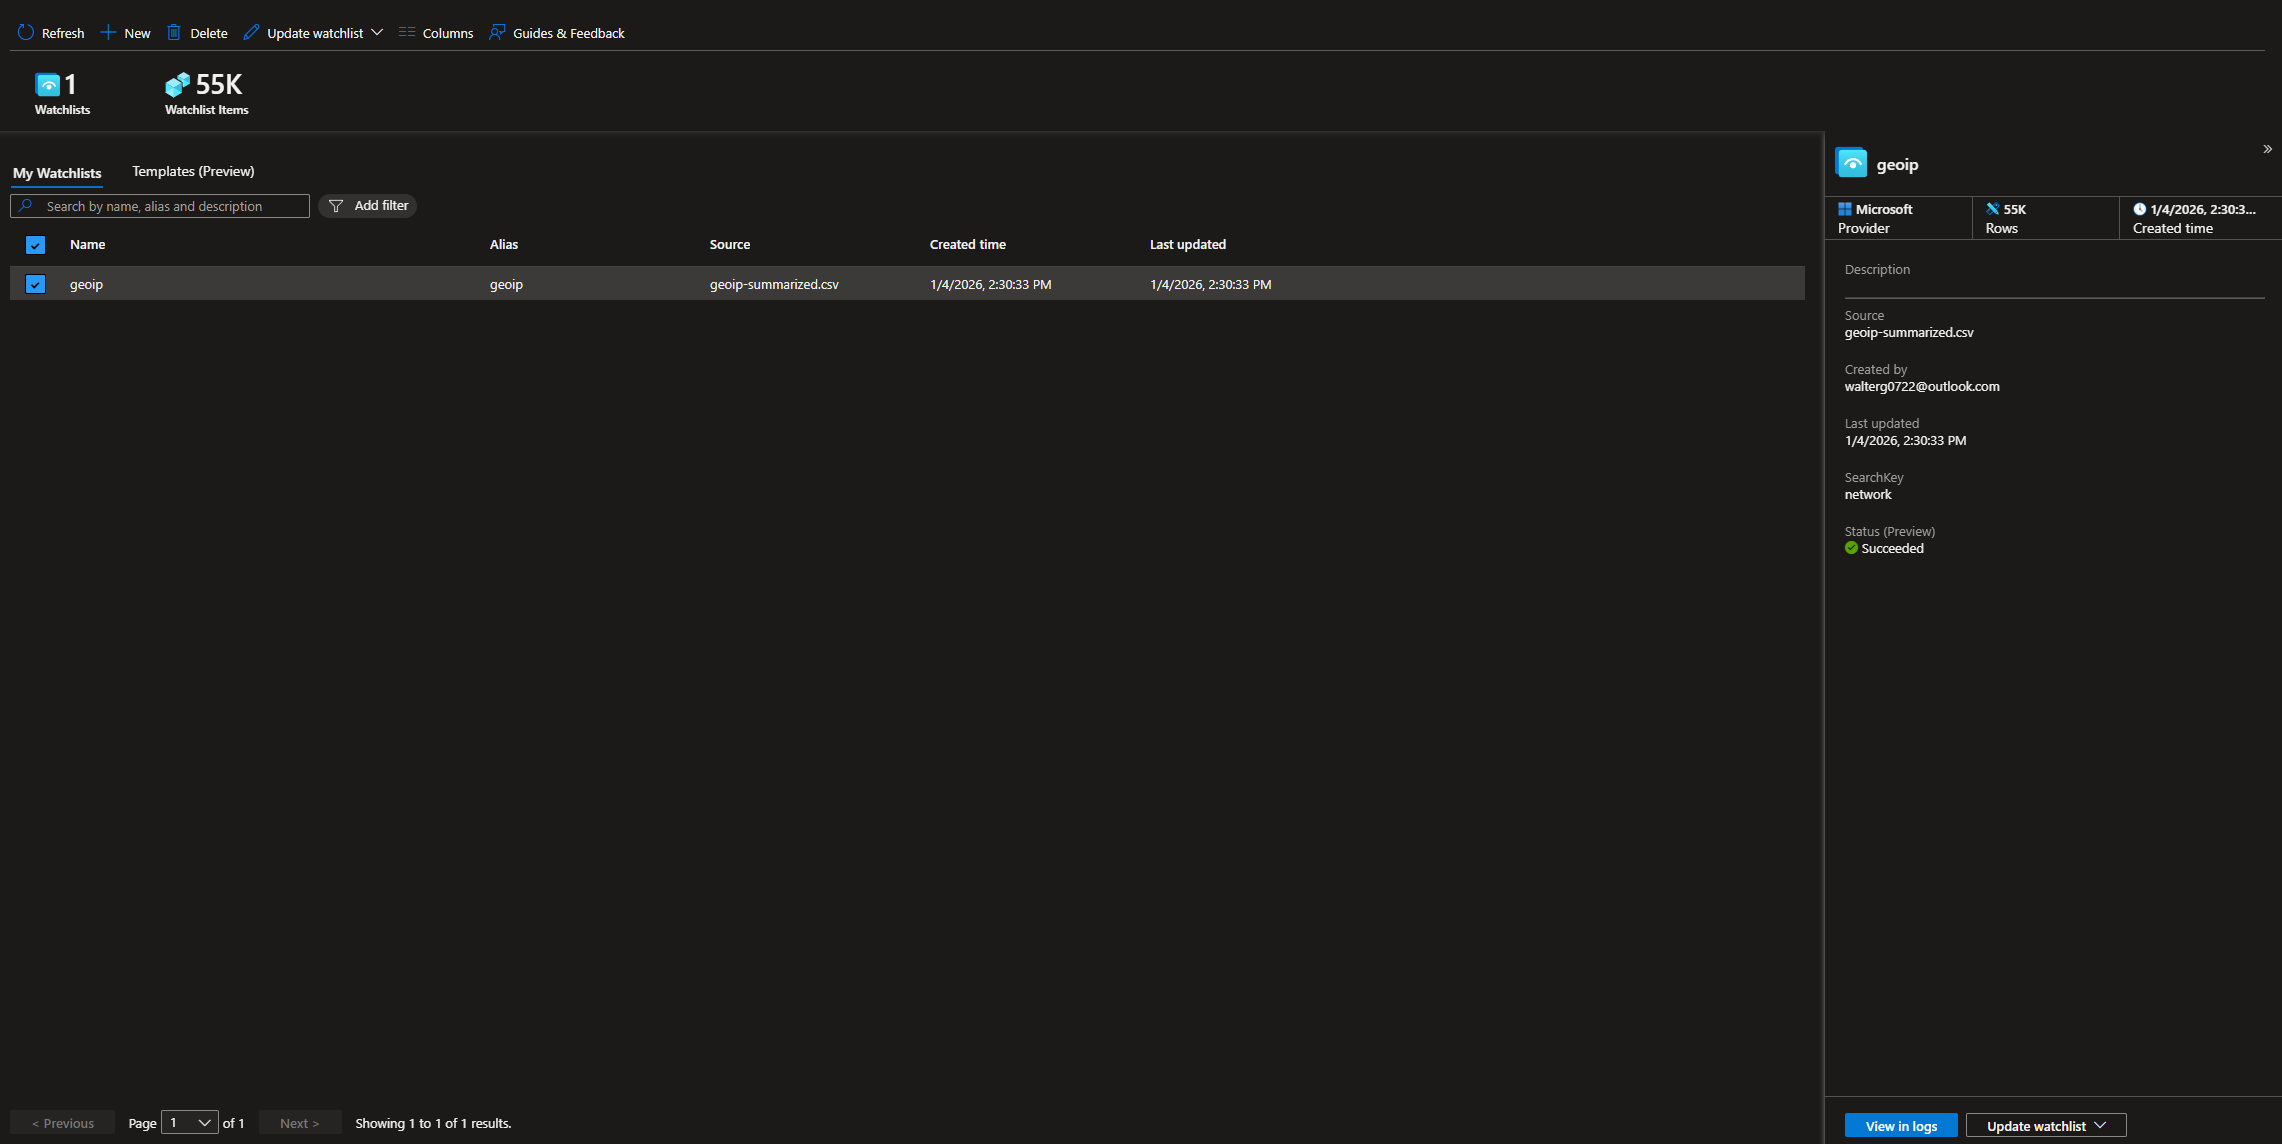
Done, we should see 55k watchlist items
Next, head to Sentinel > Logs
Run the following query: SecurityEvent | where EventID = “4625”
Scroll to the right and select a random IP address (I chose the first IP address, starting with 123)
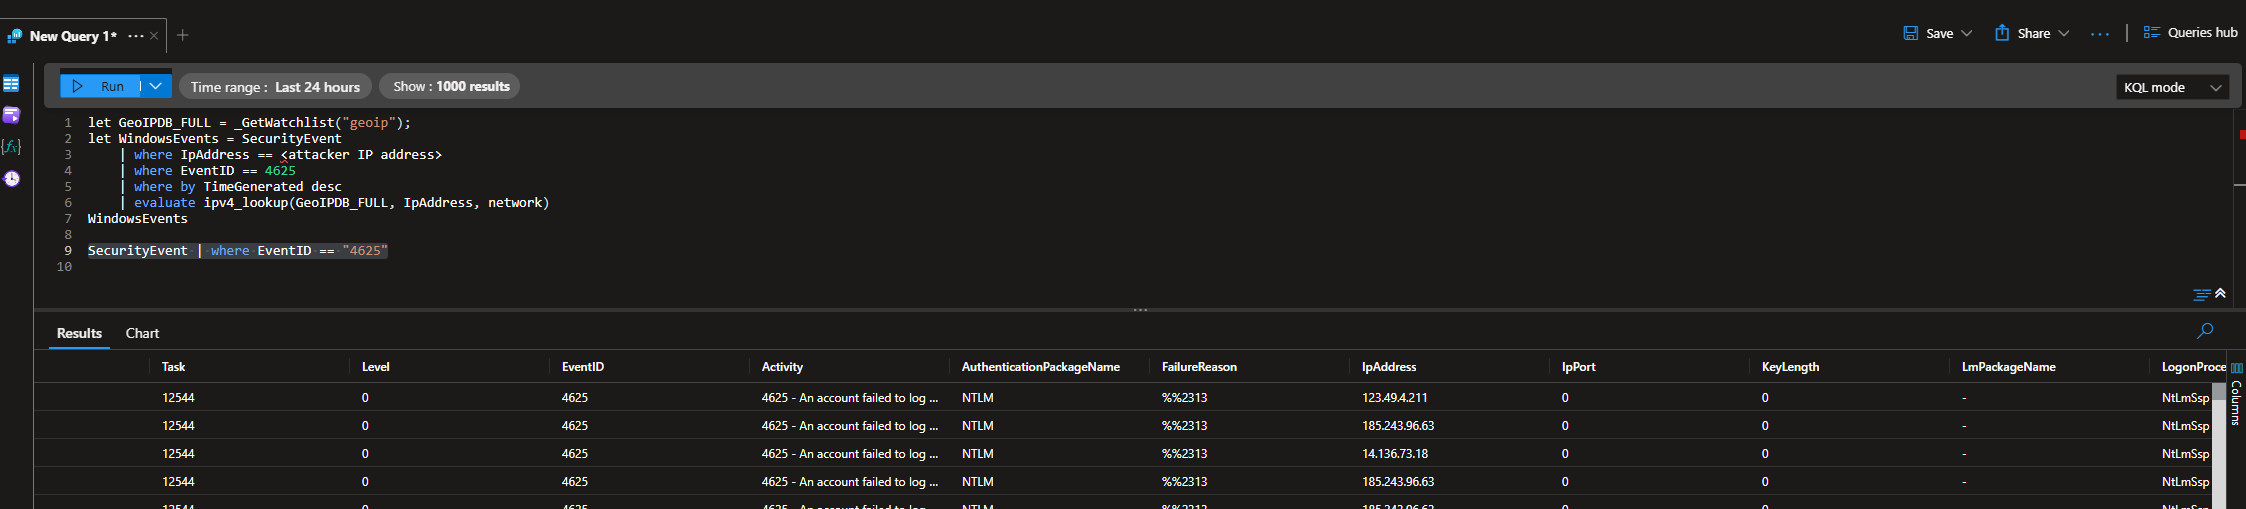
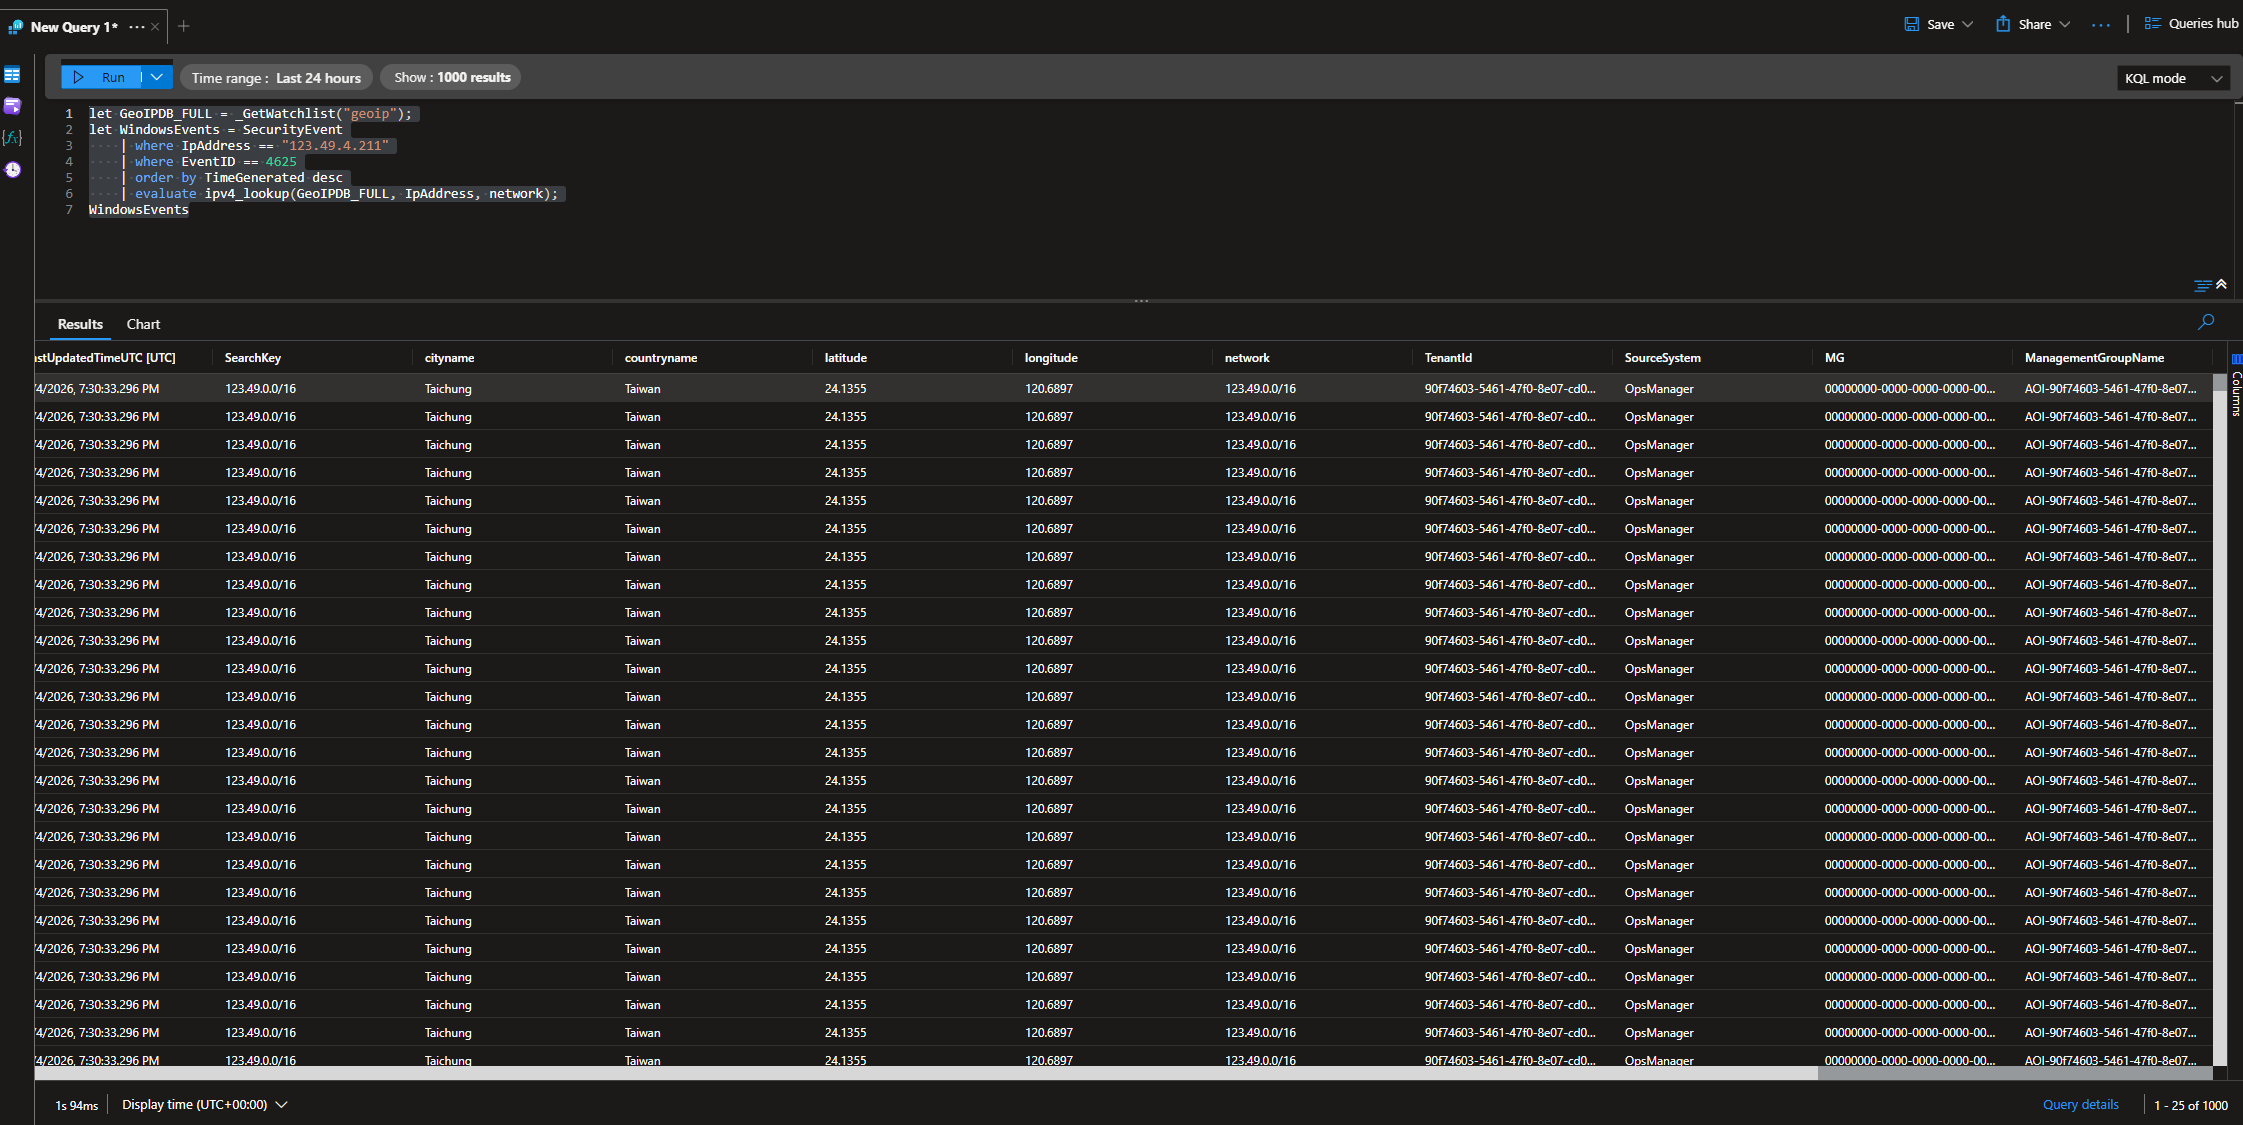
This is the query I ran, replacing <ip address> with the actual IP (123.49.4.211)
1
2
3
4
5
6
7
let GeoIPDB_FULL = _GetWatchlist("geoip");
let WindowsEvents = SecurityEvent
    | where IpAddress == <ip address>
    | where EventID == 4625
    | order by TimeGenerated desc
    | evaluate ipv4_lookup(GeoIPDB_FULL, IpAddress, network);
WindowsEvents
It seems like that IP range (123.49.0.0/16) belongs to an ISP from Taiwan
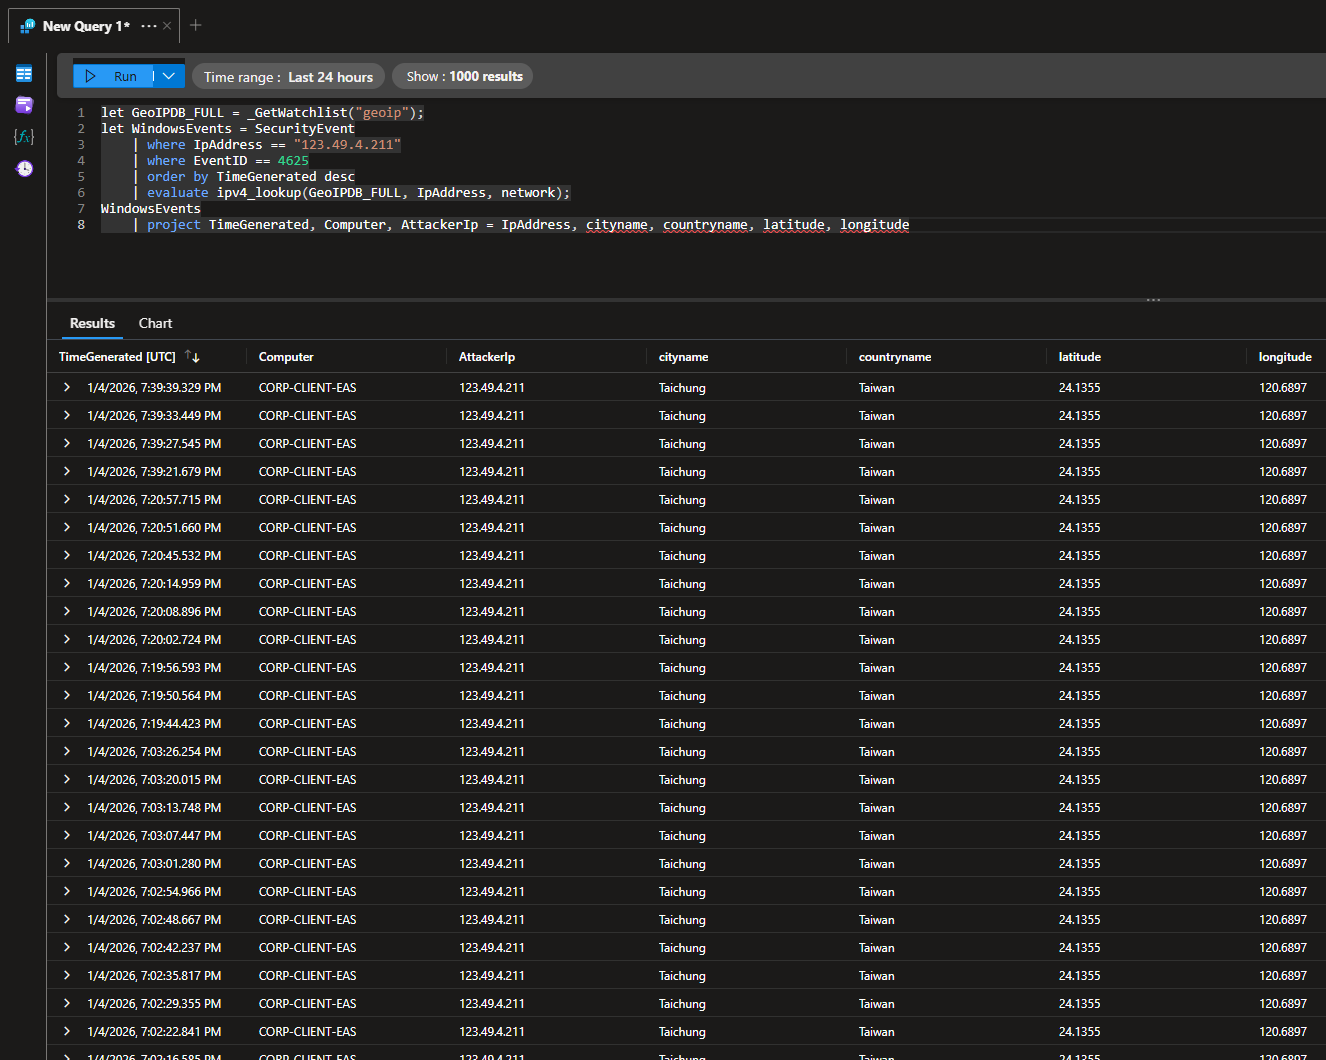
We can make this query better by using the project operator to list out relevant fields
1
2
3
4
5
6
7
8
let GeoIPDB_FULL = _GetWatchlist("geoip");
let WindowsEvents = SecurityEvent
    | where IpAddress == <ip address>
    | where EventID == 4625
    | order by TimeGenerated desc
    | evaluate ipv4_lookup(GeoIPDB_FULL, IpAddress, network);
WindowsEvents
	| project TimeGenerated, Computer, AttackerIp = IpAddress, cityname, countryname, latitude, longitude
Here, we see the attacker’s actual IP, followed by the city, country, and coordinates.
Sentinel Map Workbook
Head to Sentinel > Threat management > Workbooks
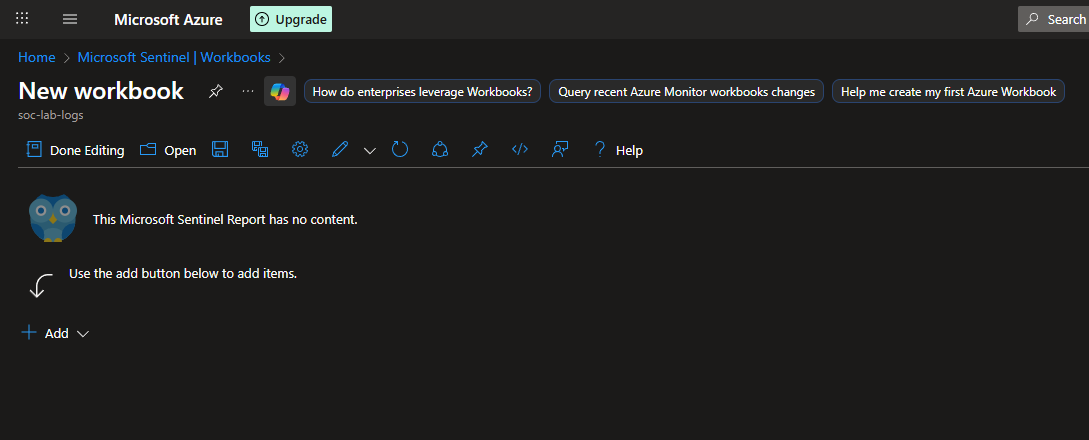
Click edit (top left button) and remove the templates until the workspace is blank
Then, click Add > Add query
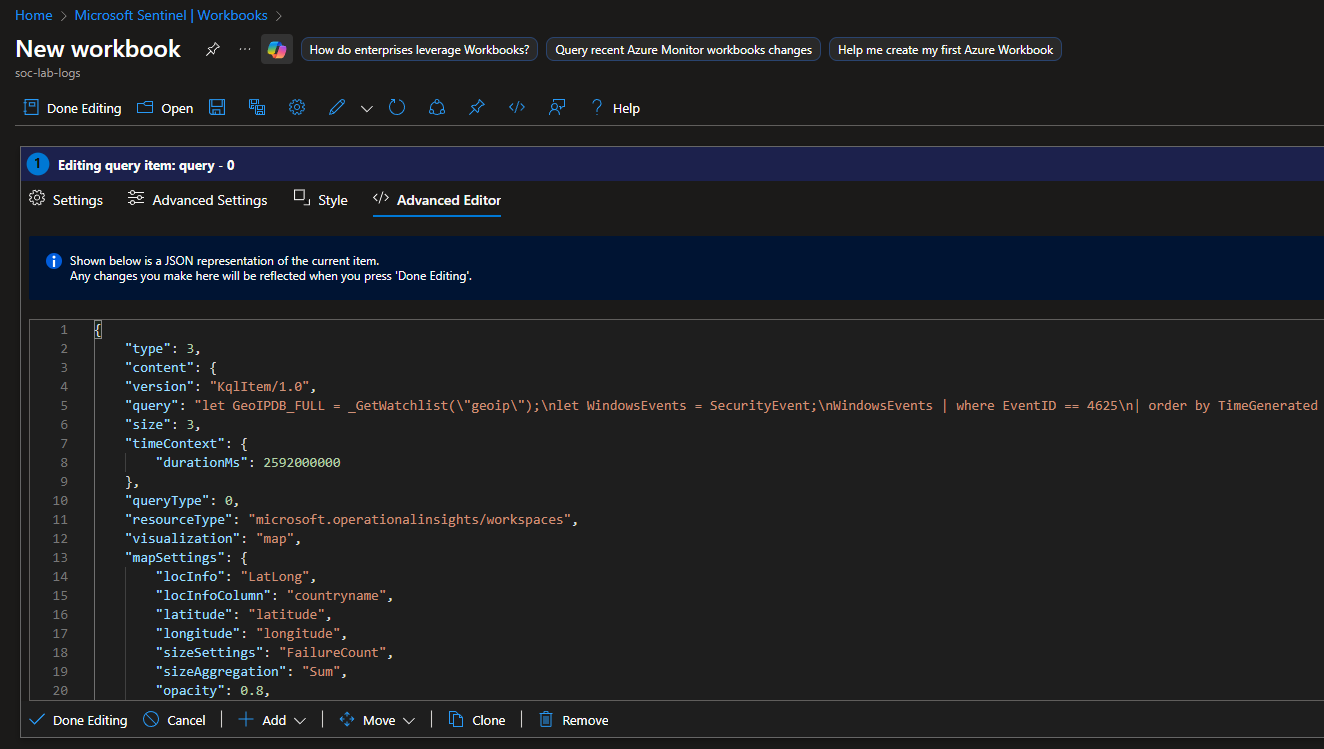
Click advanced editor and paste the following JSON contents:
1
2
3
4
5
6
7
8
9
10
11
12
13
14
15
16
17
18
19
20
21
22
23
24
25
26
27
28
29
30
31
32
33
{
	"type": 3,
	"content": {
	"version": "KqlItem/1.0",
	"query": "let GeoIPDB_FULL = _GetWatchlist(\"geoip\");\nlet WindowsEvents = SecurityEvent;\nWindowsEvents | where EventID == 4625\n| order by TimeGenerated desc\n| evaluate ipv4_lookup(GeoIPDB_FULL, IpAddress, network)\n| summarize FailureCount = count() by IpAddress, latitude, longitude, cityname, countryname\n| project FailureCount, AttackerIp = IpAddress, latitude, longitude, city = cityname, country = countryname,\nfriendly_location = strcat(cityname, \" (\", countryname, \")\");",
	"size": 3,
	"timeContext": {
		"durationMs": 2592000000
	},
	"queryType": 0,
	"resourceType": "microsoft.operationalinsights/workspaces",
	"visualization": "map",
	"mapSettings": {
		"locInfo": "LatLong",
		"locInfoColumn": "countryname",
		"latitude": "latitude",
		"longitude": "longitude",
		"sizeSettings": "FailureCount",
		"sizeAggregation": "Sum",
		"opacity": 0.8,
		"labelSettings": "friendly_location",
		"legendMetric": "FailureCount",
		"legendAggregation": "Sum",
		"itemColorSettings": {
		"nodeColorField": "FailureCount",
		"colorAggregation": "Sum",
		"type": "heatmap",
		"heatmapPalette": "greenRed"
		}
	}
	},
	"name": "query - 0"
}
The JSON is just a configuration for the workbook to make a heat map of the failed login attempts. Notice the “query” value is the KQL query similar to the one we ran before. You can adjust any of these values to your liking.
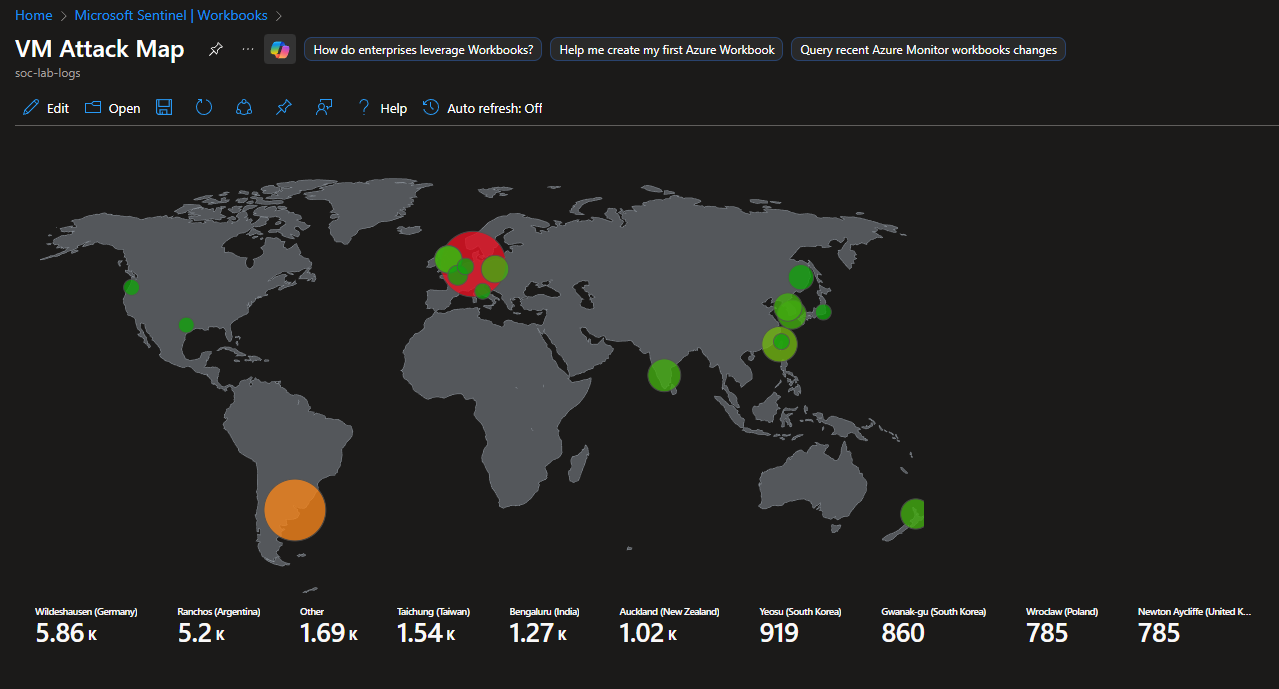
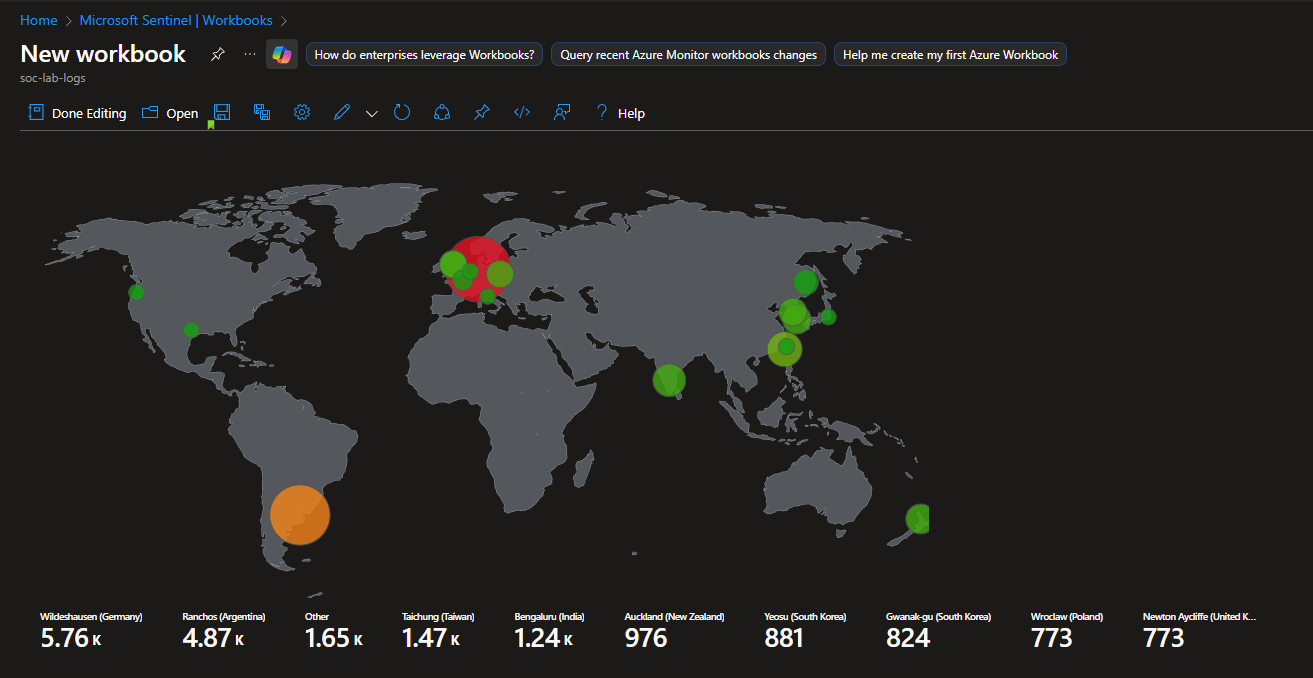
Final Map
Looks like we actually had over 10,000 failed login attempts, with most of them originating from Germany and Argentina
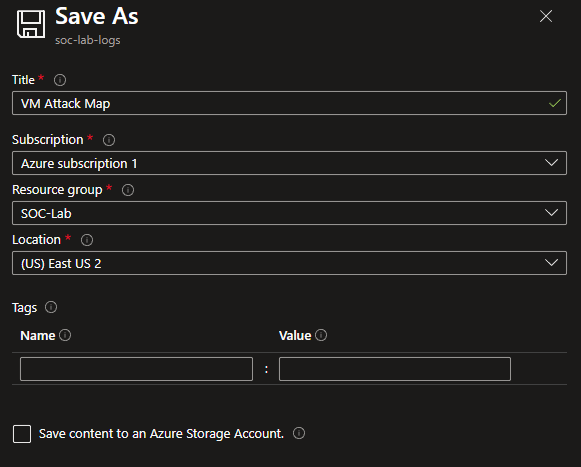
Save this workbook
This VM was running for approximately 13 hours (1/3/2026 11:00pm - 1/4/2026 12:00pm EST)